Key points:
- New York City and San Francisco Bay Area remain significantly more expensive for international schools than the other two cities in North America; Chicago and Toronto.
- No North American city had a median price under $20,000 per year. This makes the Americas the only world region in our research where the majority of median prices are above $20,000 per year.
- There is a sharp jump in the cost of international schools when comparing North America with Latin America, with a 160% increase between median prices in Panama City (the most expensive in Latin America) and Toronto (the least expensive in North America).
At the International Schools Database, we help local and expat parents choose the perfect international school for their children. Our database allows parents to find, research and compare international schools around the world. Naturally, this means that we gather and analyse a huge amount of information about international schools.
Starting in 2019, we began using this data to evaluate the prices of international schools across the globe. In this article, we share and analyze the prices of international schools in the Americas updated to 2023.
Below, we have analysed price data from 6 cities in 4 countries in the Americas, in graph and table forms. While we have used all price data available to us as of Dec 31st 2023, there may be additional schools and prices not included in each city. This is because do not make their price data available or because it is unknown to us. Links to additional research focusing on each world region individually and globally can be found at the bottom of this article and here can be found the results of the previous year 2022.
Prices of International Schools in the Americas, Per Year
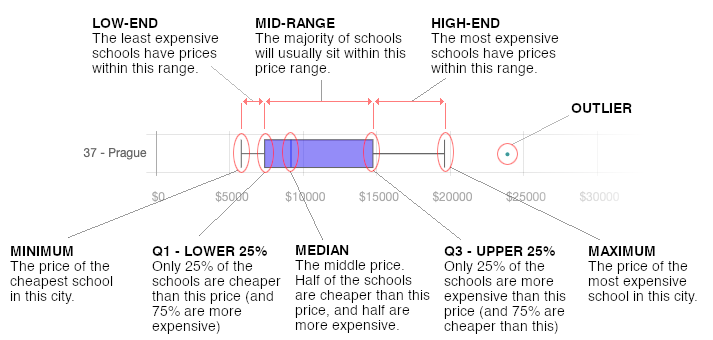
The graph below is known as a box plot graph. It shows a comprehensive view of the range of prices in each city, instead of just an average. A single average price may not necessarily represent the full picture of prices in each destination. Since there is a lot to unpack in this graph, we have also provided a little explanation on how to read the graph easily at the end of the article.
Highlights and takeaways from the research findings
When looking at North American cities only, two stand out as being significantly more expensive for international schools than the rest. These are New York City and the San Francisco Bay Area. While this isn’t necessarily surprising, what does warrant a second look is the difference between these two cities when compared with Chicago and Toronto (the other two North American cities). Median prices for international schools in the latter two cities are relatively similar; $22,540 and $21,861 respectively. That may seem very high already, but in San Francisco the median price is a sky-high $31,880 and in New York City it’s a stratospheric $45,950. Toronto’s prices may not seem so bad when you look at the bigger picture.
Thanks to the high cost of international education in North America especially, the Americas is the only world region in our research where the majority of median prices per year exceed $20,000. Whereas other regions show a more gradual increase in prices across cities, the Americas is very polarized. All cities included in our Americas research are either under $10,000 per year or over $20,000 (median prices). There are no cities in the Americas with median prices in between these figures.
We have seen this divide in previous years when comparing median prices across Latin America and North America. However, the distinction remains as sharp as ever. For example, the median price in Toronto, the least expensive North American city, is 160% higher than in Panama City, the most expensive Latin American metropolis.The difference only gets bigger when we compare the rest of the North American and Latin American cities.
You can find a breakdown of exact prices for each American city in the table below. But if the Americas isn’t enough, we have also compiled price data for other regions and cities around the world; you can find links to this additional research at the bottom of this article. If you require any further information or have additional questions, don't hesitate to contact us at andrea@international-schools-database.com.